
統計の勉強をすると、色々なデータを使いたくなります。オープンデータとGoogle に打ち込むと、機械学習に使う画像、音声、言語データは沢山出て来ます。
しかし、統計で最初に使いたいのはエクセルにまとまっているようなテーブルデータです。そんな時、Rに収納されているデータが大変役に立ちます。
今のご時世、機械学習や統計を勉強する時に、Rをはじめに触る人よりpythonから触る人の方が多いと思うので、Rのデータセットをpythonから呼び出す方法を書いておきます。
Rのデータセットにどんなものがあるかは、以下のサイトが参考になります。
PyDataset をインストールする
Rのデータセットをpythonで使う方法の一つに、PyDataset というライブラリを使う方法があります。pip install 出来ます。
!pip install pydatasetPyDataset を使う
使い方は簡単で、使いたいRのデータセットを調べてdata(“使いたいデータセット”)と打ち込むだけです。そうすると、pandas のデータフレームとしてデータが取得できます。
from pydataset import data
df = data("iris")
type(df)
#pandas.core.frame.DataFrame
データの説明文が読みたい時は、data(“使いたいデータセット”, show_doc=True)とします。1
data("iris",show_doc=True)
"""
iris

PyDataset Documentation (adopted from R Documentation. The displayed examples are in R)

## Edgar Anderson's Iris Data

### Description

This famous (Fisher's or Anderson's) iris data set gives the measurements in
centimeters of the variables sepal length and width and petal length and
width, respectively, for 50 flowers from each of 3 species of iris. The
species are _Iris setosa_, _versicolor_, and _virginica_.

### Usage

    iris
    iris3

### Format

`iris` is a data frame with 150 cases (rows) and 5 variables (columns) named
`Sepal.Length`, `Sepal.Width`, `Petal.Length`, `Petal.Width`, and `Species`.

`iris3` gives the same data arranged as a 3-dimensional array of size 50 by 4
by 3, as represented by S-PLUS. The first dimension gives the case number
within the species subsample, the second the measurements with names `Sepal
L.`, `Sepal W.`, `Petal L.`, and `Petal W.`, and the third the species.

### Source

Fisher, R. A. (1936) The use of multiple measurements in taxonomic problems.
_Annals of Eugenics_, **7**, Part II, 179–188.

The data were collected by Anderson, Edgar (1935). The irises of the Gaspe
Peninsula, _Bulletin of the American Iris Society_, **59**, 2–5.

### References

Becker, R. A., Chambers, J. M. and Wilks, A. R. (1988) _The New S Language_.
Wadsworth & Brooks/Cole. (has `iris3` as `iris`.)

### See Also

`matplot` some examples of which use `iris`.

### Examples

    dni3 <- dimnames(iris3)
    ii <- data.frame(matrix(aperm(iris3, c(1,3,2)), ncol = 4,
                            dimnames = list(NULL, sub(" L.",".Length",
                                            sub(" W.",".Width", dni3[[2]])))),
        Species = gl(3, 50, labels = sub("S", "s", sub("V", "v", dni3[[3]]))))
    all.equal(ii, iris) # TRUE
"""
data()で、使用できるデータセットの一覧を取得できます。
data()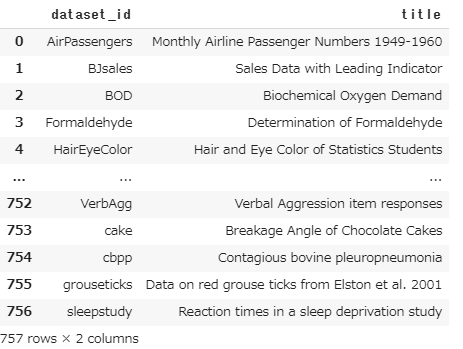
大量にあり、説明も簡素なので、検討をつけてからデータセットを直接呼び出した方が良いでしょう。
いかがでしたか?
Rのデータセットは大量にあり、かつ統計処理の練習に向いたものが多くて便利なので紹介しました。